Many countries have implemented national climate policies to accomplish pledged Nationally Determined Contributions and to contribute to the temperature objectives of the Paris Agreement on climate change. In 2023, the global stocktake will assess the combined effort of countries. Here, based on a public policy database and a multi-model scenario analysis, we show that implementation of current policies leaves a median emission gap of 22.4 to 28.2 GtCO2eq by 2030 with the optimal pathways to implement the well below 2 °C and 1.5 °C Paris goals. If Nationally Determined Contributions would be fully implemented, this gap would be reduced by a third. Interestingly, the countries evaluated were found to not achieve their pledged contributions with implemented policies (implementation gap), or to have an ambition gap with optimal pathways towards well below 2 °C. This shows that all countries would need to accelerate the implementation of policies for renewable technologies, while efficiency improvements are especially important in emerging countries and fossil-fuel-dependent countries.

The objective of the Paris Climate Agreement is to hold average global warming to well below 2 °C above pre-industrial levels and to pursue efforts to limit the temperature increase to 1.5 °C 1 . While this objective is formulated at the global level, the success of the agreement critically depends on the implementation of climate policies at the national level. This is organised in the agreement by the requirement of countries to submit nationally determined contributions (NDCs). Countries are expected to update their NDCs in 2020. While NDCs should be submitted by every country and updated every five years, their policies and targets are not legally binding. Previous studies have highlighted that taken together, the NDCs and national policies fall significantly short of the overall ambition of the Paris Agreement 2,3,4 . To achieve the targets from the NDCs, countries are implementing policies at the national level. The Paris Agreement facilitates a global stocktake in 2023, which is expected to take stock of the collective efforts and to inform the preparation of more ambitious NDCs. For this, clear insights are needed into the impact of current implemented national policies from individual countries. At the moment, no peer reviewed literature exists that has assessed the global and country impact of national climate policies on the basis of a comprehensive policy inventory by using a suite of integrated assessment models, and using this to guide additional policy implementation. Such a multi-model approach using a range of model types (simulation/optimisation, general or partial equilibrium) adds to the robustness of the assessment.
The aim of this article is to fill this knowledge gap and to provide insights into the impact of national policies in comparison to emission pathways consistent with the NDCs and overall goals of the Paris Agreement. Consequently, we divide the total emissions gap between national policies and well below 2 °C pathways into an implementation gap referring to the difference between the impact of national policies and the NDCs, and an ambition gap referring to the difference between the impact of the NDCs and well below 2 °C emission pathways. The results are presented for seven large economies and the world. The analysis was done by first establishing a list of high-impact policies 5 for each G20 economy selected from a detailed open-access policy database 6 , and translating these to input parameters for integrated assessment models. Subsequently, the model results allowed to assess the direct impact of these policies, as well as their interactions. The results are also presented in terms of the Kaya identity allowing to indicate how to close the implementation and ambition gaps 7,8 . The nine integrated assessment models (see Methods) used in this study have all submitted data for the 1.5 °C scenarios to the IPCC 1.5 °C report 9 . To evaluate the coherence of the national pathways, we compared the aggregated results of the integrated assessment models with similar runs of national models for the same countries.
Model-based scenarios have played a major role in supporting international climate policy already for a few decades. The focus of model analyses, however, has been mostly on exploring cost-optimal response strategies required to meet the climate temperature goals and simplified representations of national policies, typically incorporating them as overall emission reduction targets implemented via carbon prices 10,11,12 . The new phase of climate policy after Paris requires new information on the long-term contribution of specific policies. While some assessments have accounted for more explicit climate policy formulations in different parts of the world, these are typically single model exercises or focus only on the NDCs 11,13,14,15,16 . As such, the current work adds to the literature.
Owing to the aggregation level of most IAMs, our analysis is limited to the national policies and NDCs for G20 economies that represent 75% of total 2010 greenhouse gas emissions. It is estimated that the countries with high-impact policies, but not included in our assessment, represent around 5% of global 2010 emissions (see Supplementary Table 1). The collected policies have been made available in an open-access database 6 and cover implemented and planned national policies up to 2017. As introduction of new policies mostly occurs simultaneously with key international accords 17 , this inventory contains most of the relevant policies that were introduced around the Paris Agreement. A selection from this database was made that consisted of around ten policies for each G20 country that were expected to have high impact on greenhouse gas emissions based on literature or national expert opinion, that were adopted by national governments trough legislation or executive orders, and no evidence exists of large barriers to implementation. The results are presented at the global level and for the seven large emitting economies for which national models were available, i.e., Brazil, China, the European Union, India, Japan, the Russian Federation and the United States, together representing around 65% of global 2010 greenhouse gas emissions 18 .
The results show that if no additional action is taken beyond current implemented national climate policies, greenhouse gas emissions are projected to increase substantially between 2015 and 2030, although 5.3% lower compared to the hypothetical situation if these policies would not have been implemented. Current national policies together, leave a median global total emissions gap by 2030 of 22.4 Gigaton CO2 equivalent (GtCO2eq) with a cost-optimal 2 °C emission pathway, and 28.2 GtCO2eq with a 1.5 °C pathway. The 2 °C global emissions gap can be reduced by a third, if conditional NDCs were fully implemented, which would close the global implementation gap, but would still leave a significant ambition gap. For seven large individual countries (China, the United States, India, the European Union, Japan, Brazil and the Russian Federation), policy implementation is expected to reduce emissions at the national level by 0 to 9% (median estimates) compared to the hypothetical situation if no policies would be implemented. This leaves a small implementation gap for China, India, Japan, Russian Federation as they are close to achieving their NDC, while this is not the case for the European Union, United States and Brazil, but their ambition gap is smaller as NDCs are close to the cost-optimal 2 °C pathways.
In total, five scenarios were evaluated (see Table 1 and Supplementary Note 1). The starting point of all scenarios is the SSP2 scenario 19,20 , which is a middle-of-the-road scenario assuming a business-as-usual conduct representing no new climate policies implementation after 2010 (no new policies scenario). The national policies scenario represents the impact of policies implemented domestically to fulfil the NDC promises that are included in the NDC scenario. The 2 °C and 1.5 °C scenarios look into cost-optimal implementation of the overall goals of the Paris Agreement. To provide guidance on enhancing policy implementation, the impact of policies is decomposed by computing a set of indicators based on the Kaya identity (see Supplementary Note 2). Besides greenhouse gas emissions, also the share of low-carbon (no fossil-fuels without carbon capture and storage) technologies and energy efficiency is presented.
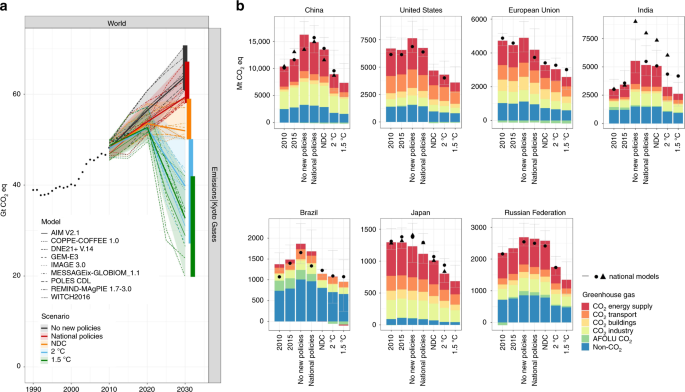
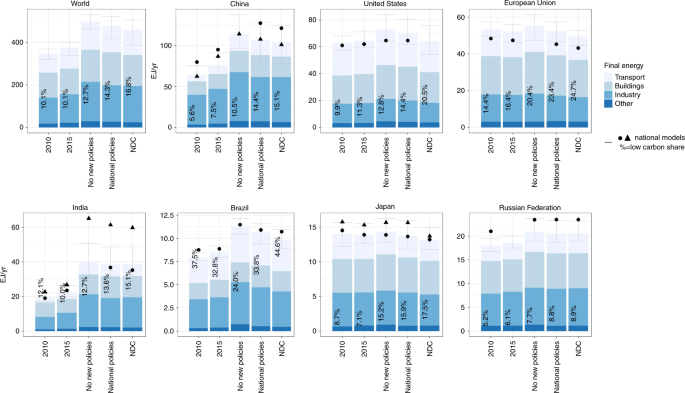
For achieving conditional NDCs, deeper reductions are necessary than those achieved by national policies only. The implementation of conditional NDCs (NDC scenario) is projected to result in 51.9 (50.4–57.4) GtCO2eq greenhouse gas emissions by 2030, a low-carbon share of final energy at 16.8% (12.6%–25.2%), and 23.5% (17.9%–30.0%) in energy-intensity improvement between 2015 and 2030. This means that national policies together leave a significant global implementation gap with respect to the NDC targets by 2030, which is 7.7 (5.3–9.7) GtCO2eq for emissions (see Table 3). This gap by 2030 can be closed by increasing the low-carbon share by 2.8 pp (1.5–4.7 pp), and decreasing energy intensity by 12.7% (9.1%–16.1%). Final energy reductions under the NDC scenario compared with the national policies scenario, occur especially in the transport and buildings sector (see Fig. 2).
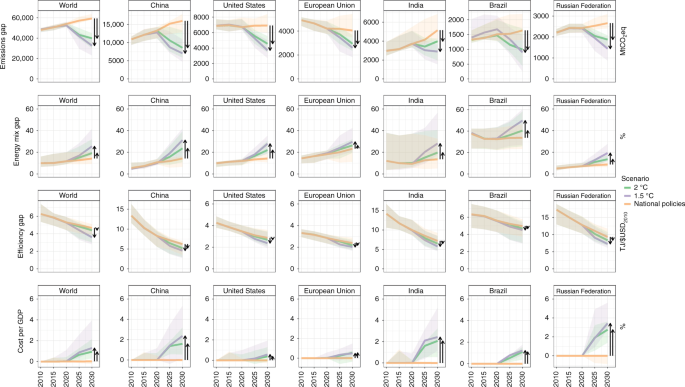
The Kaya identity allows to break this up into an energy mix gap (share of low-carbon emitting technologies in final energy) and an efficiency gap (final energy-intensity improvement relative to the results of the implementation of national policies), and a carbon-intensity gap (see Supplementary Figs. 1 and 2). To close the gap by 2030 with the National policies scenario, the non-fossil share would need to increase by 6.9 pp (4.0%–12.3%) (energy mix gap), and the energy-intensity needs to improve by 9.6% (4.8%–24.7%)) (efficiency improvement gap). These numbers are 13.0% (7.2%–24.0%) and 17.5% (12.5%–26.8%) for the 1.5 °C case (see Fig. 3). Global annual mitigation costs per GDP by 2030, under the national policies scenario, are small, and increase to 0.9% (0.3%–2.2%) under the 2 °C scenario, and to 1.3% (1.0%–4.0%) under the 1.5 °C scenario (see Fig. 3). The global emissions gap with the 2 °C scenario can be reduced by a third, if conditional NDCs would be fully implemented, leaving a median ambition gap of 16.5 GtCO2eq (6.4–21.0) with 2 °C pathways and 21.2 GtCO2eq (12.2–31.6) with 1.5 °C pathways.
For the seven individual G20 countries, greenhouse gas emissions by 2030 would need to decrease compared to the national policies scenario by 25 to 41% (median) to stay on track to keep temperature below 2 °C, while this is 33 to 54% (median) under the 1.5 °C scenario (see Table 2 and Fig. 3). These gaps can be closed by strongly increasing the low-carbon share of final energy by 5.4 pp for the European Union to 8.5 pp for China to stay below 2 °C, and between 5.4 pp in the European Union to 20.2 pp in China for the 1.5 °C case. Projections for final energy intensity give a different picture, where the difference between the National policies scenario and the 2 °C scenarios are small for the European Union, Japan and the United States, somewhat larger (and more uncertain) for Brazil, and largest for China, India and the Russian Federation (See Fig. 3). Closing the gap between national policies and 2 °C or 1.5 °C pathways by 2030 would result in additional median mitigation costs per GDP of between 0.5% for the European Union to 2.8% for the Russian Federation for the 2 °C case, while this is 0.6% to 3.4% for the 1.5 °C case (see Fig. 3).
To give an indication of the short-term impact of national policies in the context of the long-term global targets, we present the indicator that is defined as the cumulative emissions in the 2011–2050 period divided by the 2010 emissions, and in addition assume countries pursue the same national efforts between 2030 and 2050 under the National policies scenario by keeping total percentage emission reductions relative to the No new policies scenario constant. The indicator allows for comparing countries with different absolute emission levels, and provides the number of years an economy can emit at 2010 emission levels while staying below the total cumulative emissions of the next 40 years. A value of 40 indicates that, on average, the emission level will remain constant. In the same way as for the shorter period until 2030, comparison of the results with the trajectories for the 2 °C and 1.5 °C maximum temperature increases shows a large gap (Fig. 4). Interestingly, the NDC projections by 2050 for the European Union, Brazil, and the United States are relatively close to the 2 °C scenario, suggesting that these regions would mostly need to ensure that their national policies more closely lead to the NDC target (which may possibly already be achieved through very recent policy updates). It should, however, be noted that cost-optimal implementation (equal marginal costs in all regions) leads to higher costs, as a percentage of GDP, in low-income regions and, therefore, is a fair way to implement the Paris Agreement (see Supplementary Note 3) only if complemented by financial transfers. Effort-sharing approaches based on equity considerations tend to suggest larger reduction targets for high-income regions 24 .
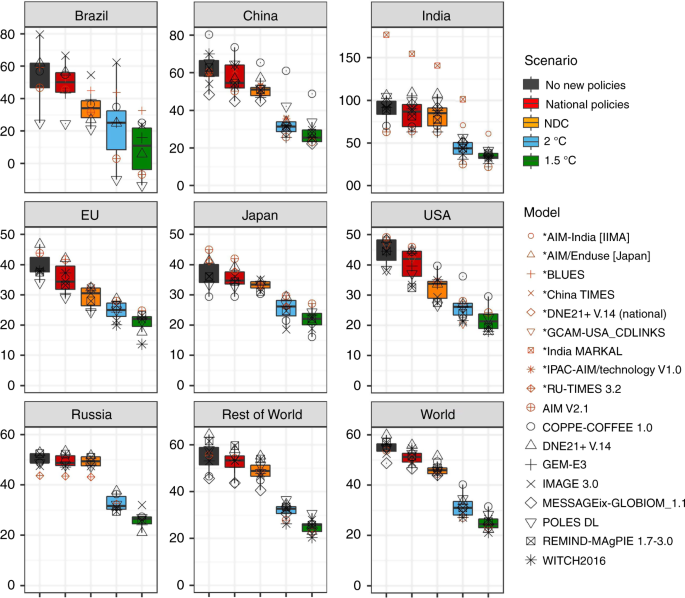
The 2 °C and 1.5 °C model ranges for Brazil are large as a result of the uncertainty in land-use-related emissions. In terms of cost-optimal mitigation, large reductions in each G20 economy are necessary to stay within the 400 Gt carbon budget. The median estimate for cumulative emissions relative to 2010, under this scenario, is at a similar level, between 20 and 25, except for Brazil and India, indicating that given the estimated cumulative emissions in the national policies scenario, strong efforts are essential by almost all countries.
The results show that for all countries there is either a significant implementation gap or ambition gap. Unless governments increase ambition, the collective effort of current national policies significantly stays short of the objectives of the Paris Agreement and even fails to meet the joint ambition secured in NDCs. The results have strong implications beyond 2030. Previous literature has shown that inadequate near-term reduction efforts imply that a substantially higher rate of transformation will be needed to comply with the 2 °C limit 11 , stranded assets 25 and substantially higher mitigation costs in the long term, and reduced techno-economic mitigation potential due to carbon lock-in 26 .
In all, 2 °C and 1.5 °C pathways in this study are calculated assuming cost-optimal implementation, but it might not be the most realistic approach to deriving national reduction targets, as it would typically lead to relatively high costs in low-income countries. In contrast, effort-sharing approaches based on equity principles would lead to lower allowance of cumulative emissions in the EU, Japan, the Russian Federation and the United States, and to higher allowances for India (see Supplementary Fig. 3), resulting in an opposite impact on the gap between national policies and these allowances. If cost-effective climate policy would be adopted, emission trading or transnational climate financing could still ensure a cost-optimal implementation. If less cooperation between countries is assumed, a different allocation would increase total costs of implementation.
One crucial question that arises from this analysis is how to speed up implementation to achieve NDCs, and increase ambition to stay on track to meet well below 2° goals? The current policy implementation is weak and includes significant gaps (e.g., industry, freight transport policies). Moreover, it is also often fragmented in terms of the use of policy instruments and the coverage of sectors and countries. A redesign of current policy mixes consisting of more coherent policies, including for instance the use of economy-wide financial instruments 27 , may respond to the current call for strengthened policies. In practical terms, it is possible to draw lessons from the policy mixes used in our analysis—for instance by identifying to most successful mitigation measures. In identifying such good practices it is important to evaluate measures in terms of cost effectiveness but also in terms of reducing public policy constraints such as distribution of costs 28 , ability to address uncertainty 29 , and political feasibility to intervene in the economy 30 . A careful redesign in combination with international cooperation could avoid carbon leakage to other sectors and countries, avoid stranded assets 31 , and increase regulatory power of governments.
In 2020, countries are expected to submit updated NDCs to the Paris Agreement. However, the global stocktake discussed in this article shows that large enhancements are necessary if we want to maintain the window to limiting temperature increase to well below 2 °C, or even pursue efforts to limit this to 1.5 °C. In order to do so, all countries would need to accelerate the implementation of renewable technologies, while efficiency improvements are especially important in emerging countries (China, India, Brazil) and fossil-fuel-dependent countries (Russian Federation). From this we conclude that the global stocktake in the Paris Agreement’s process would need to go beyond presenting emission gaps, but insights and guidance for how to close this gap are important. Integrated assessment models can support the policy process. At first, the national policy scenario used in this analysis could be assessed in more detail and give insights into the impact of different individual policies. In addition, the models are well furnished to present effective mitigation options to countries for policy enhancement by giving the tradeoffs between impact and costs of different policy packages in the context of global efforts. Other effectiveness criteria could be captured with different scenarios. Finally, as the new policy questions require more detailed information, model development could go into the direction of including more countries, sectors and actors or link to bottom-up energy and land use models.
The assessment of the impact of national climate policies on greenhouse gas emissions is based on the model exercise that was done as part of the CD-LINKS project, and for which guidelines were described in the global and national model protocols 32,33 . This project aimed, among other things, to develop global low development pathways on a global level and for G20 economies, including an explicit representation of near-term policy trends. For this paper, we selected seven large G20 economies in terms of greenhouse gas emissions (Brazil, China, the EU, India, Japan, Russian Federation, United States), for which also national climate and energy models were available in the project.
Integrated assessment models (IAMs) describe key processes in the interaction of human development and natural environment and are designed to assess the implications of achieving climate objectives 2,34 . The model exercise that assessed the impact of climate policies was done by nine IAMs that have global coverage, and ten national models that represent a specific G20 economy (see Table 4). A more detailed description of model structure and policy implementation can be found in the Supplementary Note 4, and for some models at the IAMC wiki 35 . These models differ in country and sector aggregation level, and also in the way they mimic decisions on climate policy. All models include dynamic pricing, and therefore local climate policy will result in lower implementation in other regions with less policies. However, only the economic models explicitly account for carbon leakage. In addition, as most models assume one central planner, behaviour or decisions of different actors and the role of institutions is often not explicitly taken into account. This implies that most models (especially with simple representation of the economy) have only a limited ability to reflect the specific social and economic dynamics of the developing and transition economies 36 . Some phenomena, such as the green paradox, can only be represented by most models in an explicit scenario design. However, the models with less economic detail often have a more detailed representation of technologies in different sectors enabling them to take into account technological learning.
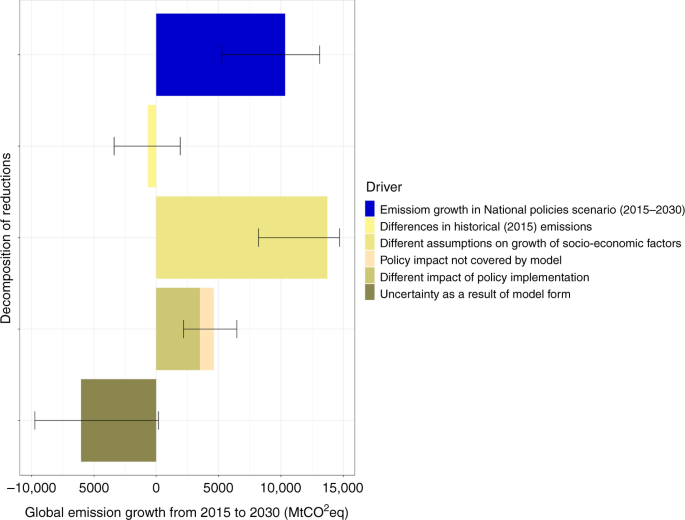
This shows that the impact of historical calibration on the projected global growth in emissions between 2015 and 2030 is small; this growth is much more dependent on socio-economic factors such as GDP and population growth. Of the total impact, the policy impact is around one third, and a somewhat larger part is real uncertainty.
The 2 °C and 1.5 °C scenarios assume cost-optimal implementation of the reduction measures after 2020 with the lowest overall mitigation costs. The result is implementation of measures in countries where this is cheapest, but this does not imply that the implementing country would need to face all the costs. These costs can be shared, and thus financed by other countries. The financial flows could be calculated if emission allowances per country are based on so-called effort-sharing approaches representing different equity principles 24,43,44 , for example, categorise the effort-sharing approaches in the literature based on the four basic equity principles, i.e., responsibility, equality, capability and cost effectiveness, and present the regional greenhouse gas emission allowances in 2020, 2030 and 2050 for these categories. The equity principles were also applied to the carbon budgets (cumulative emissions) for both the 2011–2050 and the 2011–2100 period 24 , based on calculations from the FAIR model 45 , see the Supplementary Fig. 3, for comparison with the results from our study.
Some model results were adjusted due to missing data on sectors and sub-sectors, different accounting approaches or too broad regional definitions. The DNE21 + (on country level) does not include the Agricultural, Forestry and Land Use (AFOLU) sector. Therefore, these were supplemented with average estimates from the other global models. Although the POLES model does include AFOLU CO2 emissions, based on estimates from national communications, they were harmonised with those from FAOSTAT 46 , as the accounting approaches of the individual countries were not consistent with the other IAMs. The COPPE-COFFEE model does not include F-gas emissions, which were supplemented with average estimates from the other global models. Some national models only cover energy CO2 emissions (China TIMES, China IPAC-AIM V1.0, AIM India, MARKAL India, PRIMES, RU-TIMES) and industrial CO2 emissions and non-CO2 emissions were supplemented with average model estimates from global models.
Further information on research design is available in the Nature Research Reporting Summary linked to this article.
Data reported in Figs. 1–5 and the selection of policies implemented in IAMs can be found in the Source Data. The source data files are also available at [https://doi.org/10.17632/2j7sksfh2h.1. The list of policies is based on the open source Climate Policy Database. The scenario protocol and the selection of high-impact policies that were included in the protocol are found under Work Package 2 of the deliverables & publications page of the CD-LINKS project. Model results can be found in the open-access CD-LINKS database. Policy relevant data is available in the Global Stocktake tool. CD-LINKS inventory http://www.climatepolicydatabase.org/index.php/CDlinks_policy_inventory; Climate policy database http://climatepolicydatabase.org/index.php/Climate_Policy_Database; Deliverables & publications http://www.cd-links.org/?page_id=620; CD-LINKS database https://db1.ene.iiasa.ac.at/CDLINKSDB/dsd?Action=htmlpage&page=30; Global Stocktake tool https://themasites.pbl.nl/global-stocktake-indicators/.
The code from the 20 integrated assessment models is not available in a publicly shareable version, although several have published open source code, visualisation tools or detailed documentation (see Supplementary Table 10 for details). A model description (see Supplementary Note), and a description of how national climate policies have been implemented (see Supplementary Table 4) is available.
We would like to thank the following people for reviewing the CD-LINKS climate policy database: Chenmin He from Energy Research Institute of the National Development and Research Commission, China (NDRC-ERI), Zbigniew Klimont, Nicklas Forsell, Jessica Jewell and Olga Turkovska from International Institute for Applied Systems Analysis (IIASA), Amit Garg from the Public Systems Group at the Indian Institute of Management, India (IIM), Roberta Pierfederici from Institute for Sustainable Development and International Relations (IDDRI), Ucok WR Siagian from Institut Teknologi Bandung, Indonesia (ITB), Jiyong Eom and Cheolhung Cho from Korea Advanced Institute of Science and Technology, Republic of Korea (KAIST), Takeshi Kuramochi from NewClimate Institute (NCI), Junichiro Oda from Research Institute of Innovative Technology for the Earth, Japan (RITE), Aayushi Awasthy and Swapnil Shekhar from The Energy and Resources Institute, India (TERI), Hongjun Zhang from Tsinghua University, China (TU), Nick Macaluso from Environment and Climate Change Canada (EC), Michael Boulle, Hilton Trollipp from Energy Research Centre, South Africa (ERC) and Daniel Buira (Mexico), Vladimir Potachnikov from National Research University Higher School of Economics (Russian Federation). This work is part of a project funded by the European Union’s Horizon 2020 Research and Innovation Programme under grant agreement No. 642147 (CD-LINKS), and is supported by European Union’s Horizon 2020 Research and Innovation Programme under grant agreement No. 821471 (ENGAGE) and European Union’s DG CLIMA and EuropeAid under grant agreement No. 21020701/2017/770447/SER/CLIMA.C.1 EuropeAid/138417/DH/SER/MulitOC (COMMIT). S. F., K. O.: supported by the Environment Research and Technology Development Fund (2-1908 and 2-1702) of the Environmental Restoration and Conservation Agency. J. D., K. K.: the views expressed are purely those of the writer and may not in any circumstances be regarded as stating an official position of the European Commission.